


What We Do
At Zeitview, our goal is to accelerate the transition to renewable energy and sustainable infrastructure. We do this by combining advanced inspection software with the ability to capture visual data in more than 60 countries. This allows us to deliver safer, faster, lower-cost inspections of energy and infrastructure assets with a high degree of accuracy and repeatability. We use artificial intelligence and machine learning to ingest and analyze vast amounts of visual data to provide objective insights that our customers can act on immediately.
Reliable Partnership
We are second to none at operational excellence and partnering with our customers to achieve flexible, long-term solutions across their multiple asset classes.
Your Bottom Line
Helping customers operate efficiently and lower operation and maintenance costs is key to accelerating the global transition to renewable energy and sustainable infrastructure.
Multi-Asset Expertise
For businesses operating in multiple business sectors with a variety of asset classes, Zeitview provides a single partner for advanced inspection across solar, wind, properties, telecom, and utility assets.

Zeitview Insights
Make better-informed, near real-time decisions about your most critical assets at scale.

Our Solutions
Whether you’re monitoring the progress of a construction project, analyzing the condition of rooftops, inspecting a set of wind turbines, or maintaining the health of a solar facility, you can track, survey, inspect, and manage your inspections with
Zeitview Insights.
-
![]()
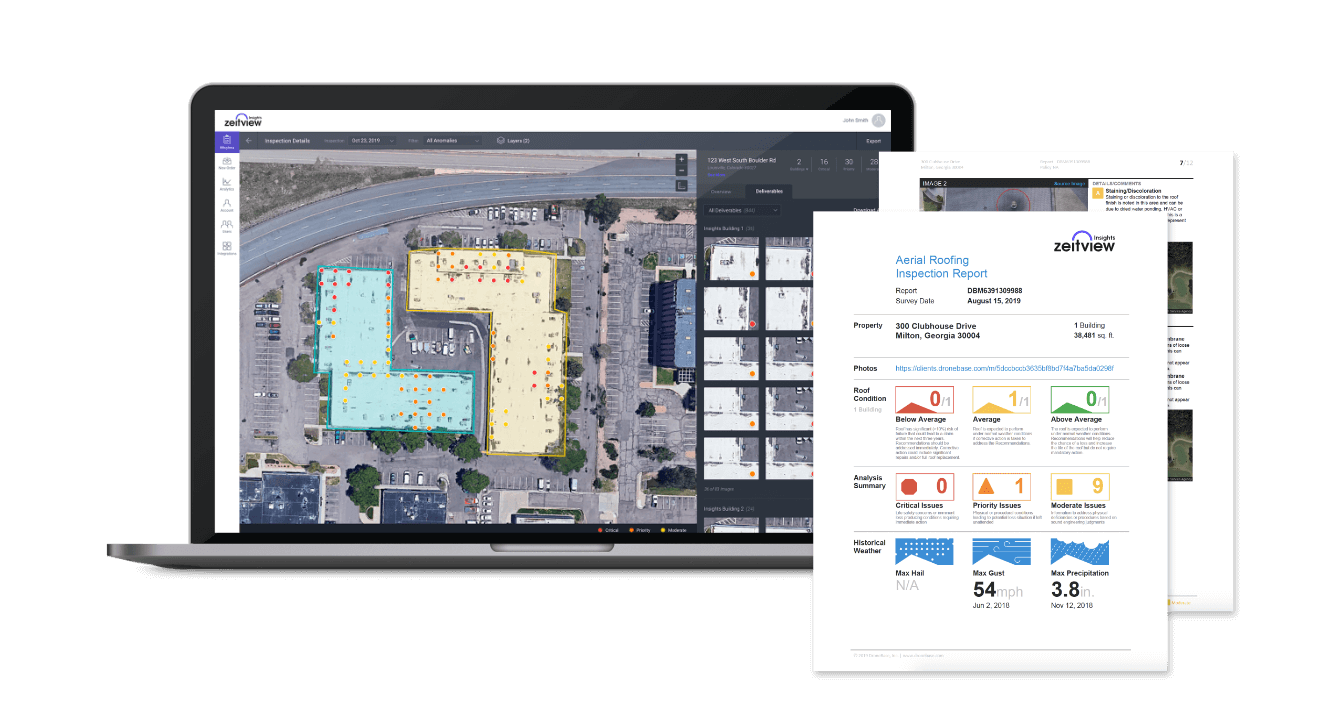
Understand Each Property’s Condition
Zeitview Property Insights delivers actionable, near real-time data of every aspect of your building. With solutions for roofing, property management, insurance and construction.
-
![]()
Mitigate Risk and Enhance Maintenance Planning
Zeitview Wind Insights fuses data collection, processing, collaboration, and reporting, to deliver efficient inspections and improve asset management.
-
![]()
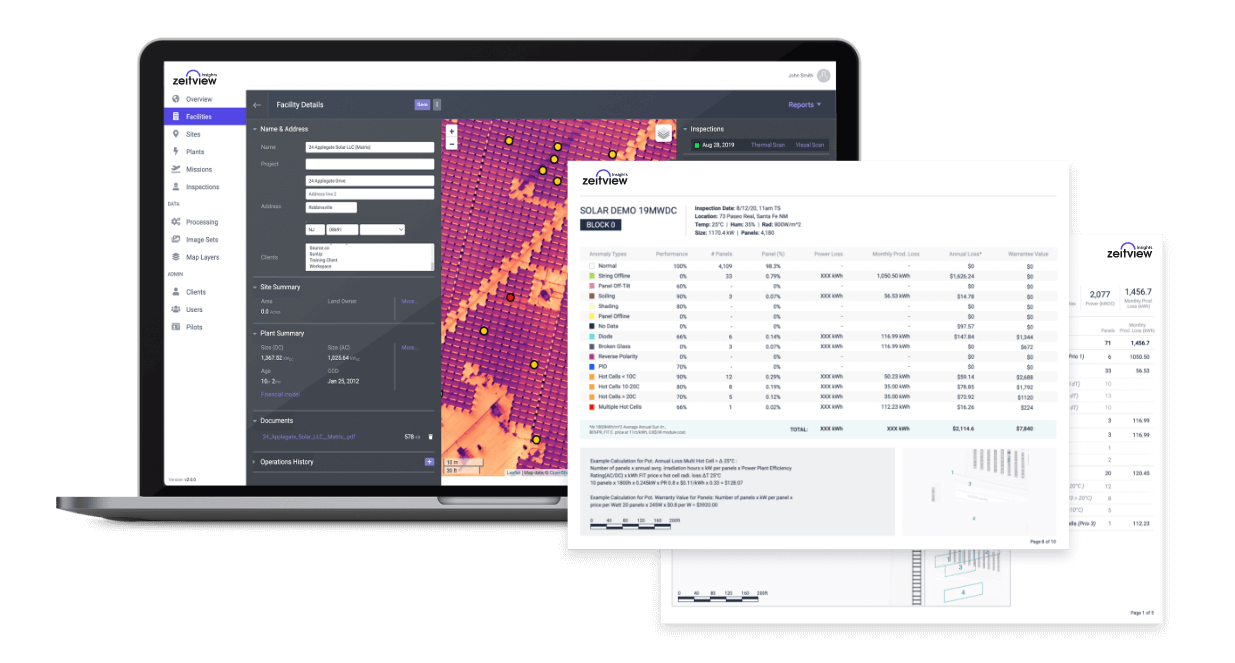
Improve Solar Asset Performance
Zeitview Solar Insights simplifies thermal inspections at scale, leveraging the industries largest global network of UAV and manned aircraft operators
-
![]()
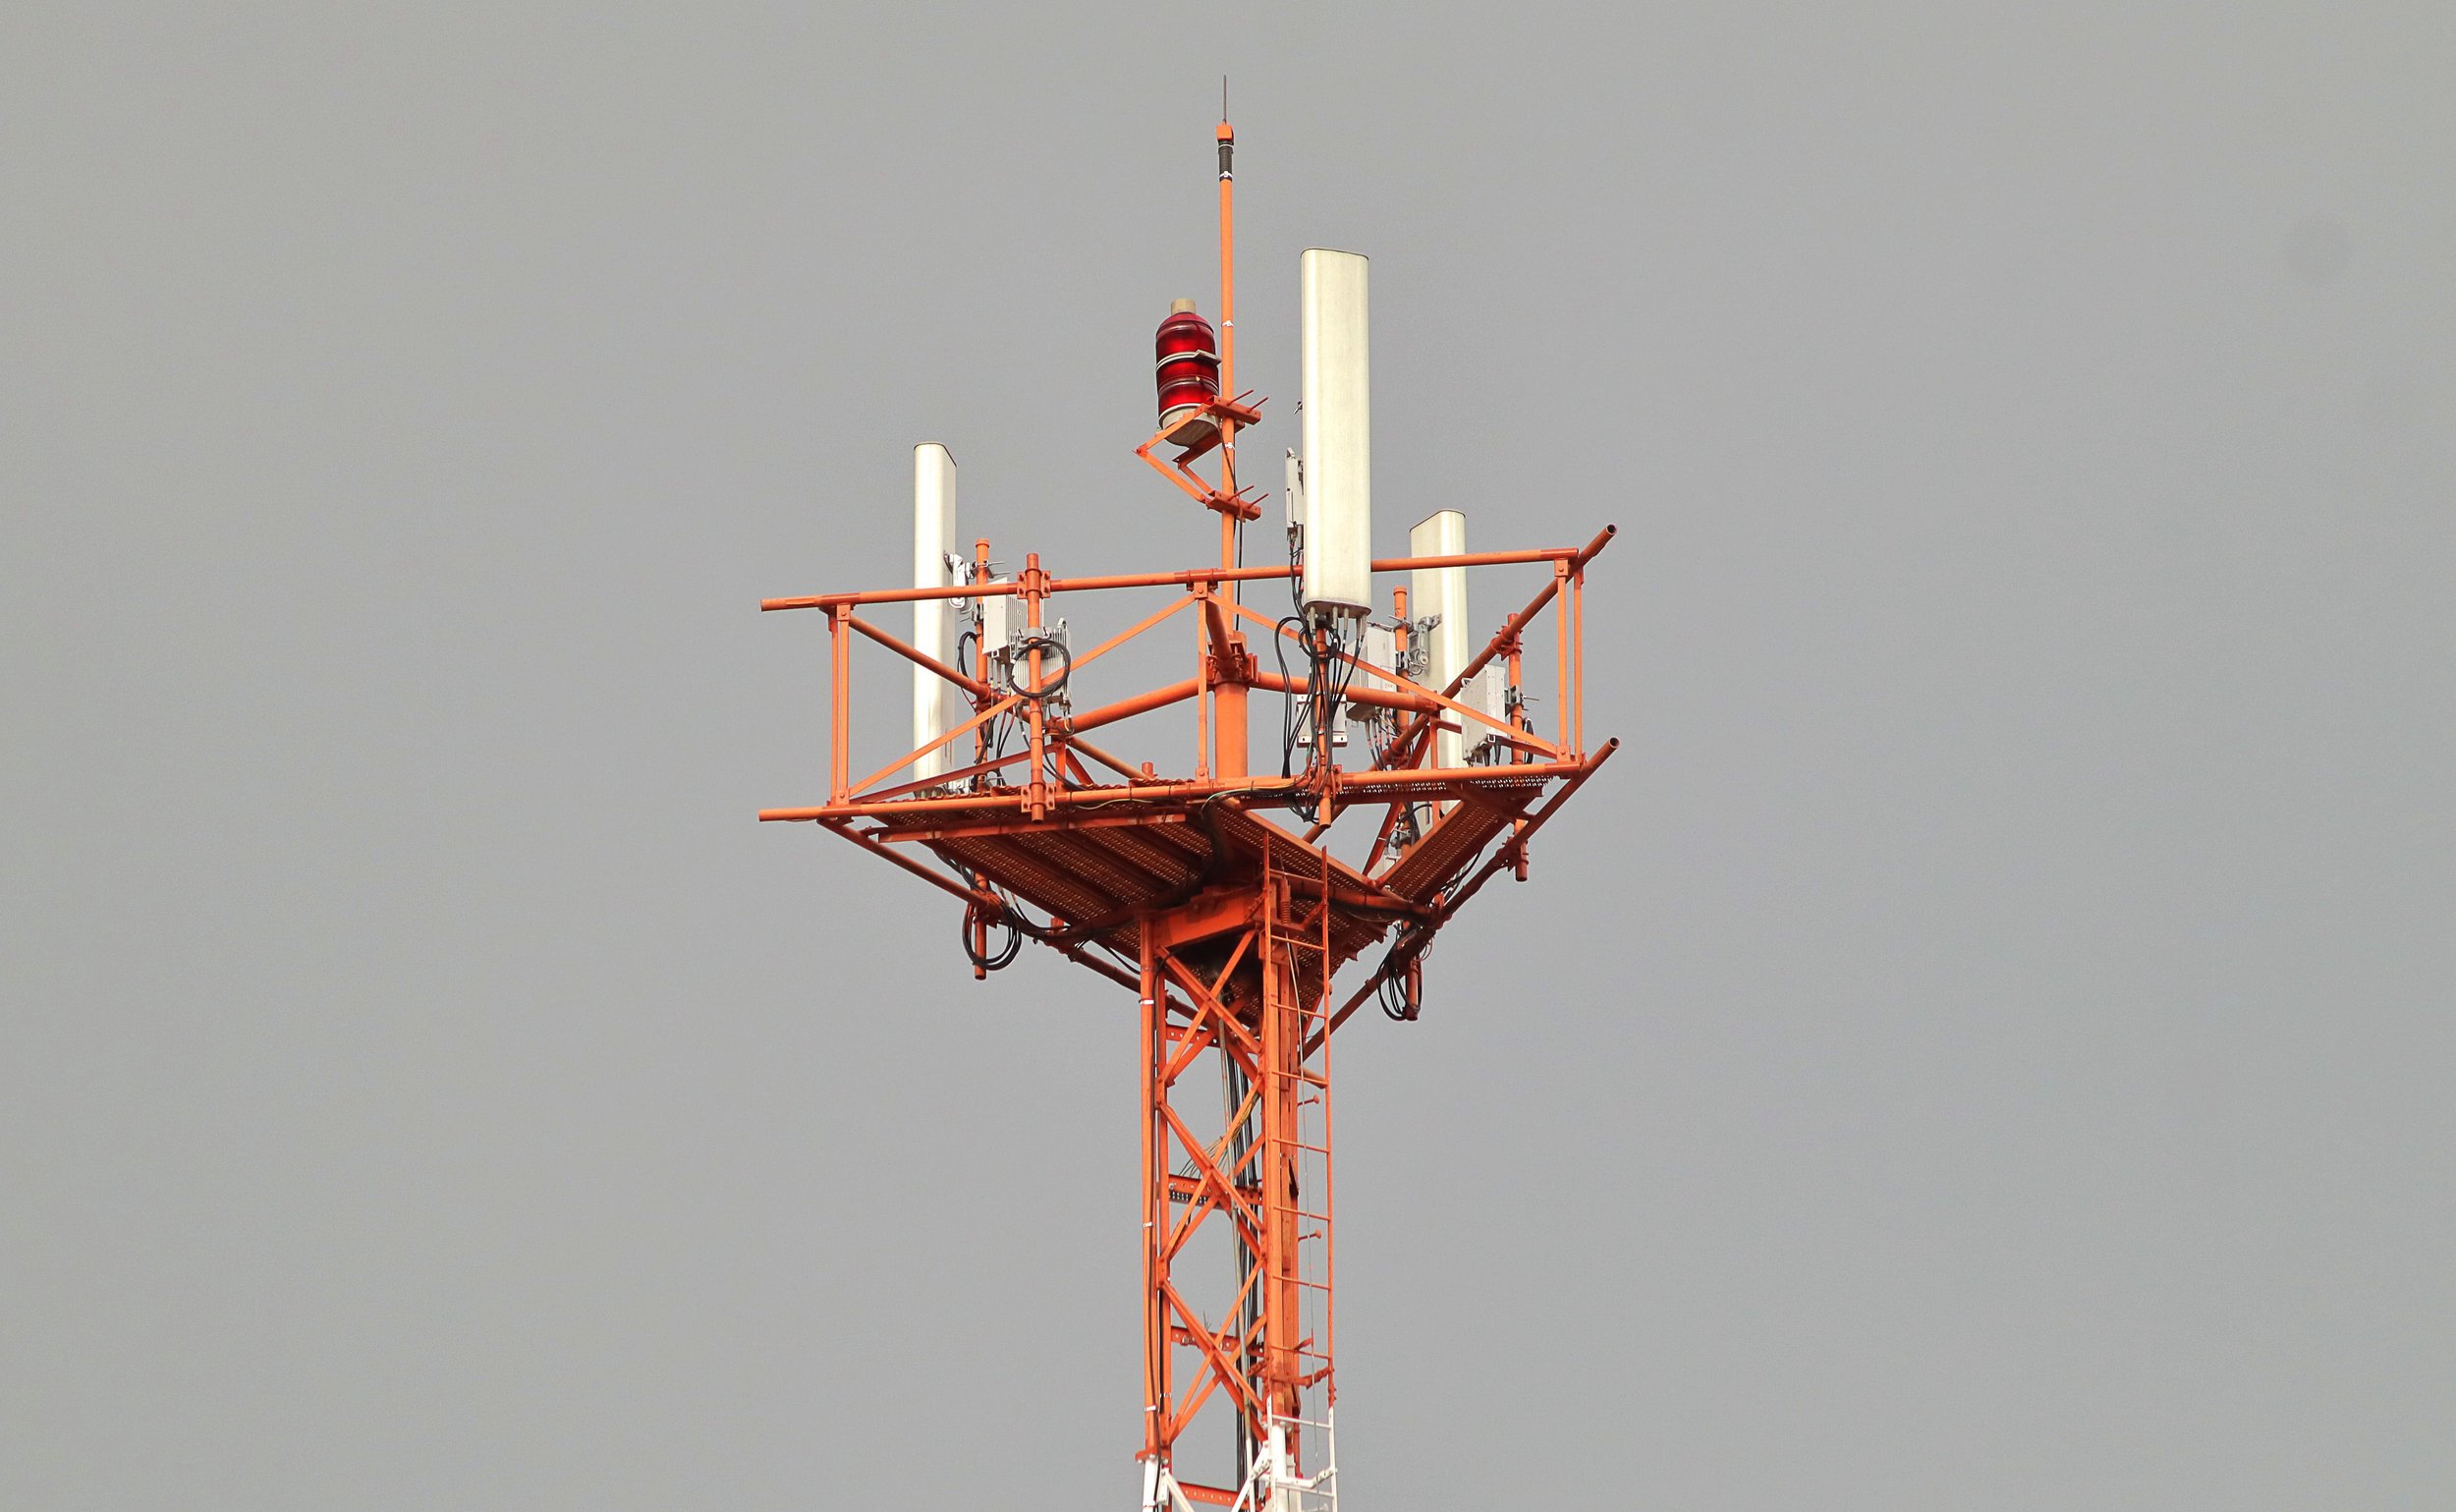
Telecom Advance Inspections
Zeitview Telecom Insights makes it easy to track inventory changes, ensure proper billing, and improve safety by reducing unnecessary tower climbs.
-
![]()
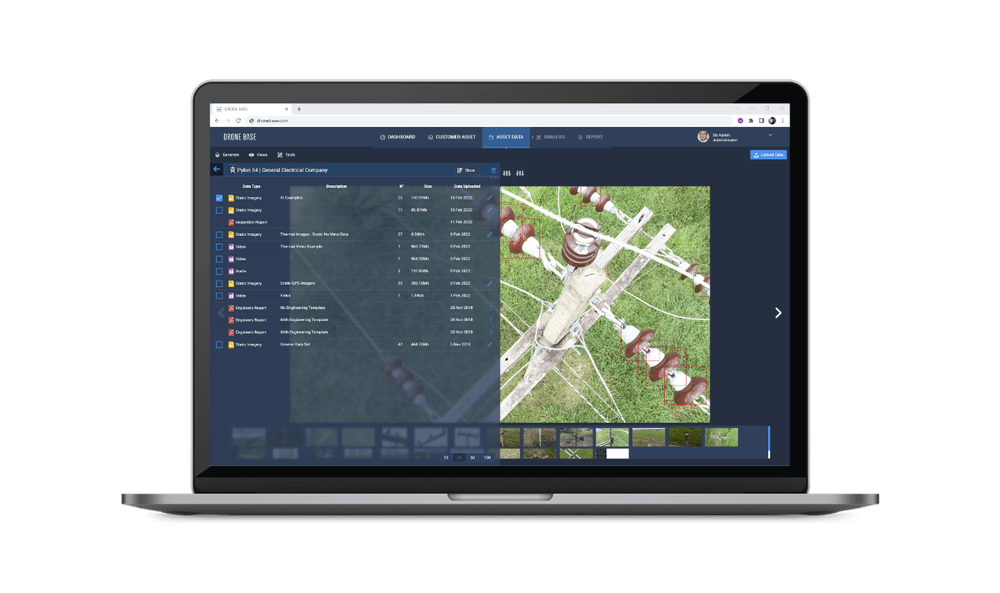
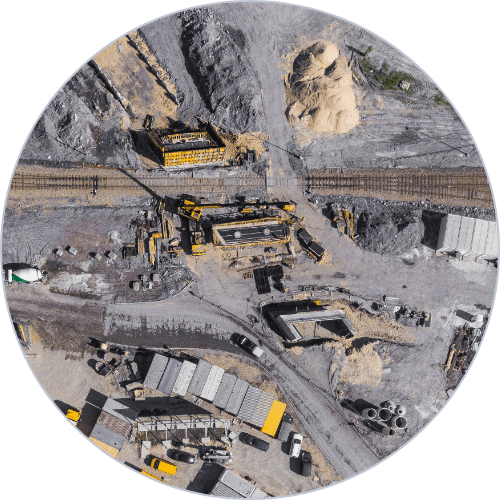
Map and Analyse Utility Assets
Zeitview Utility Insights couples the speed and accuracy of drones with the advanced analysis provided by machine learning and artificial intelligence to help reduce risk and improve grid resiliency


Industries
-
![]()
Property Management
Manage properties globally with image based inspections to assess roof health, building facades, parking lots, and more.
-
![]()
Insurance
Leverage high quality imagery across time to improve risk understanding, enhance inspection analysis and shorten policy cycle times.
-
![]()
Wind
Enhance safety and obtain precise data with image based inspections, analytics, and lifecycle management.
-
![]()
Solar
Improve site performance and energy yield of solar assets through thermal inspections and asset management tools
-
![]()
Construction
Leverage aerial data to power decisions through visual projects updates, monitoring, mapping, and models.
-
![]()
Commercial Real Estate
Attract more clients, sell real estate listings faster, and showcase your entire property with aerial imagery and video.
-
![]()
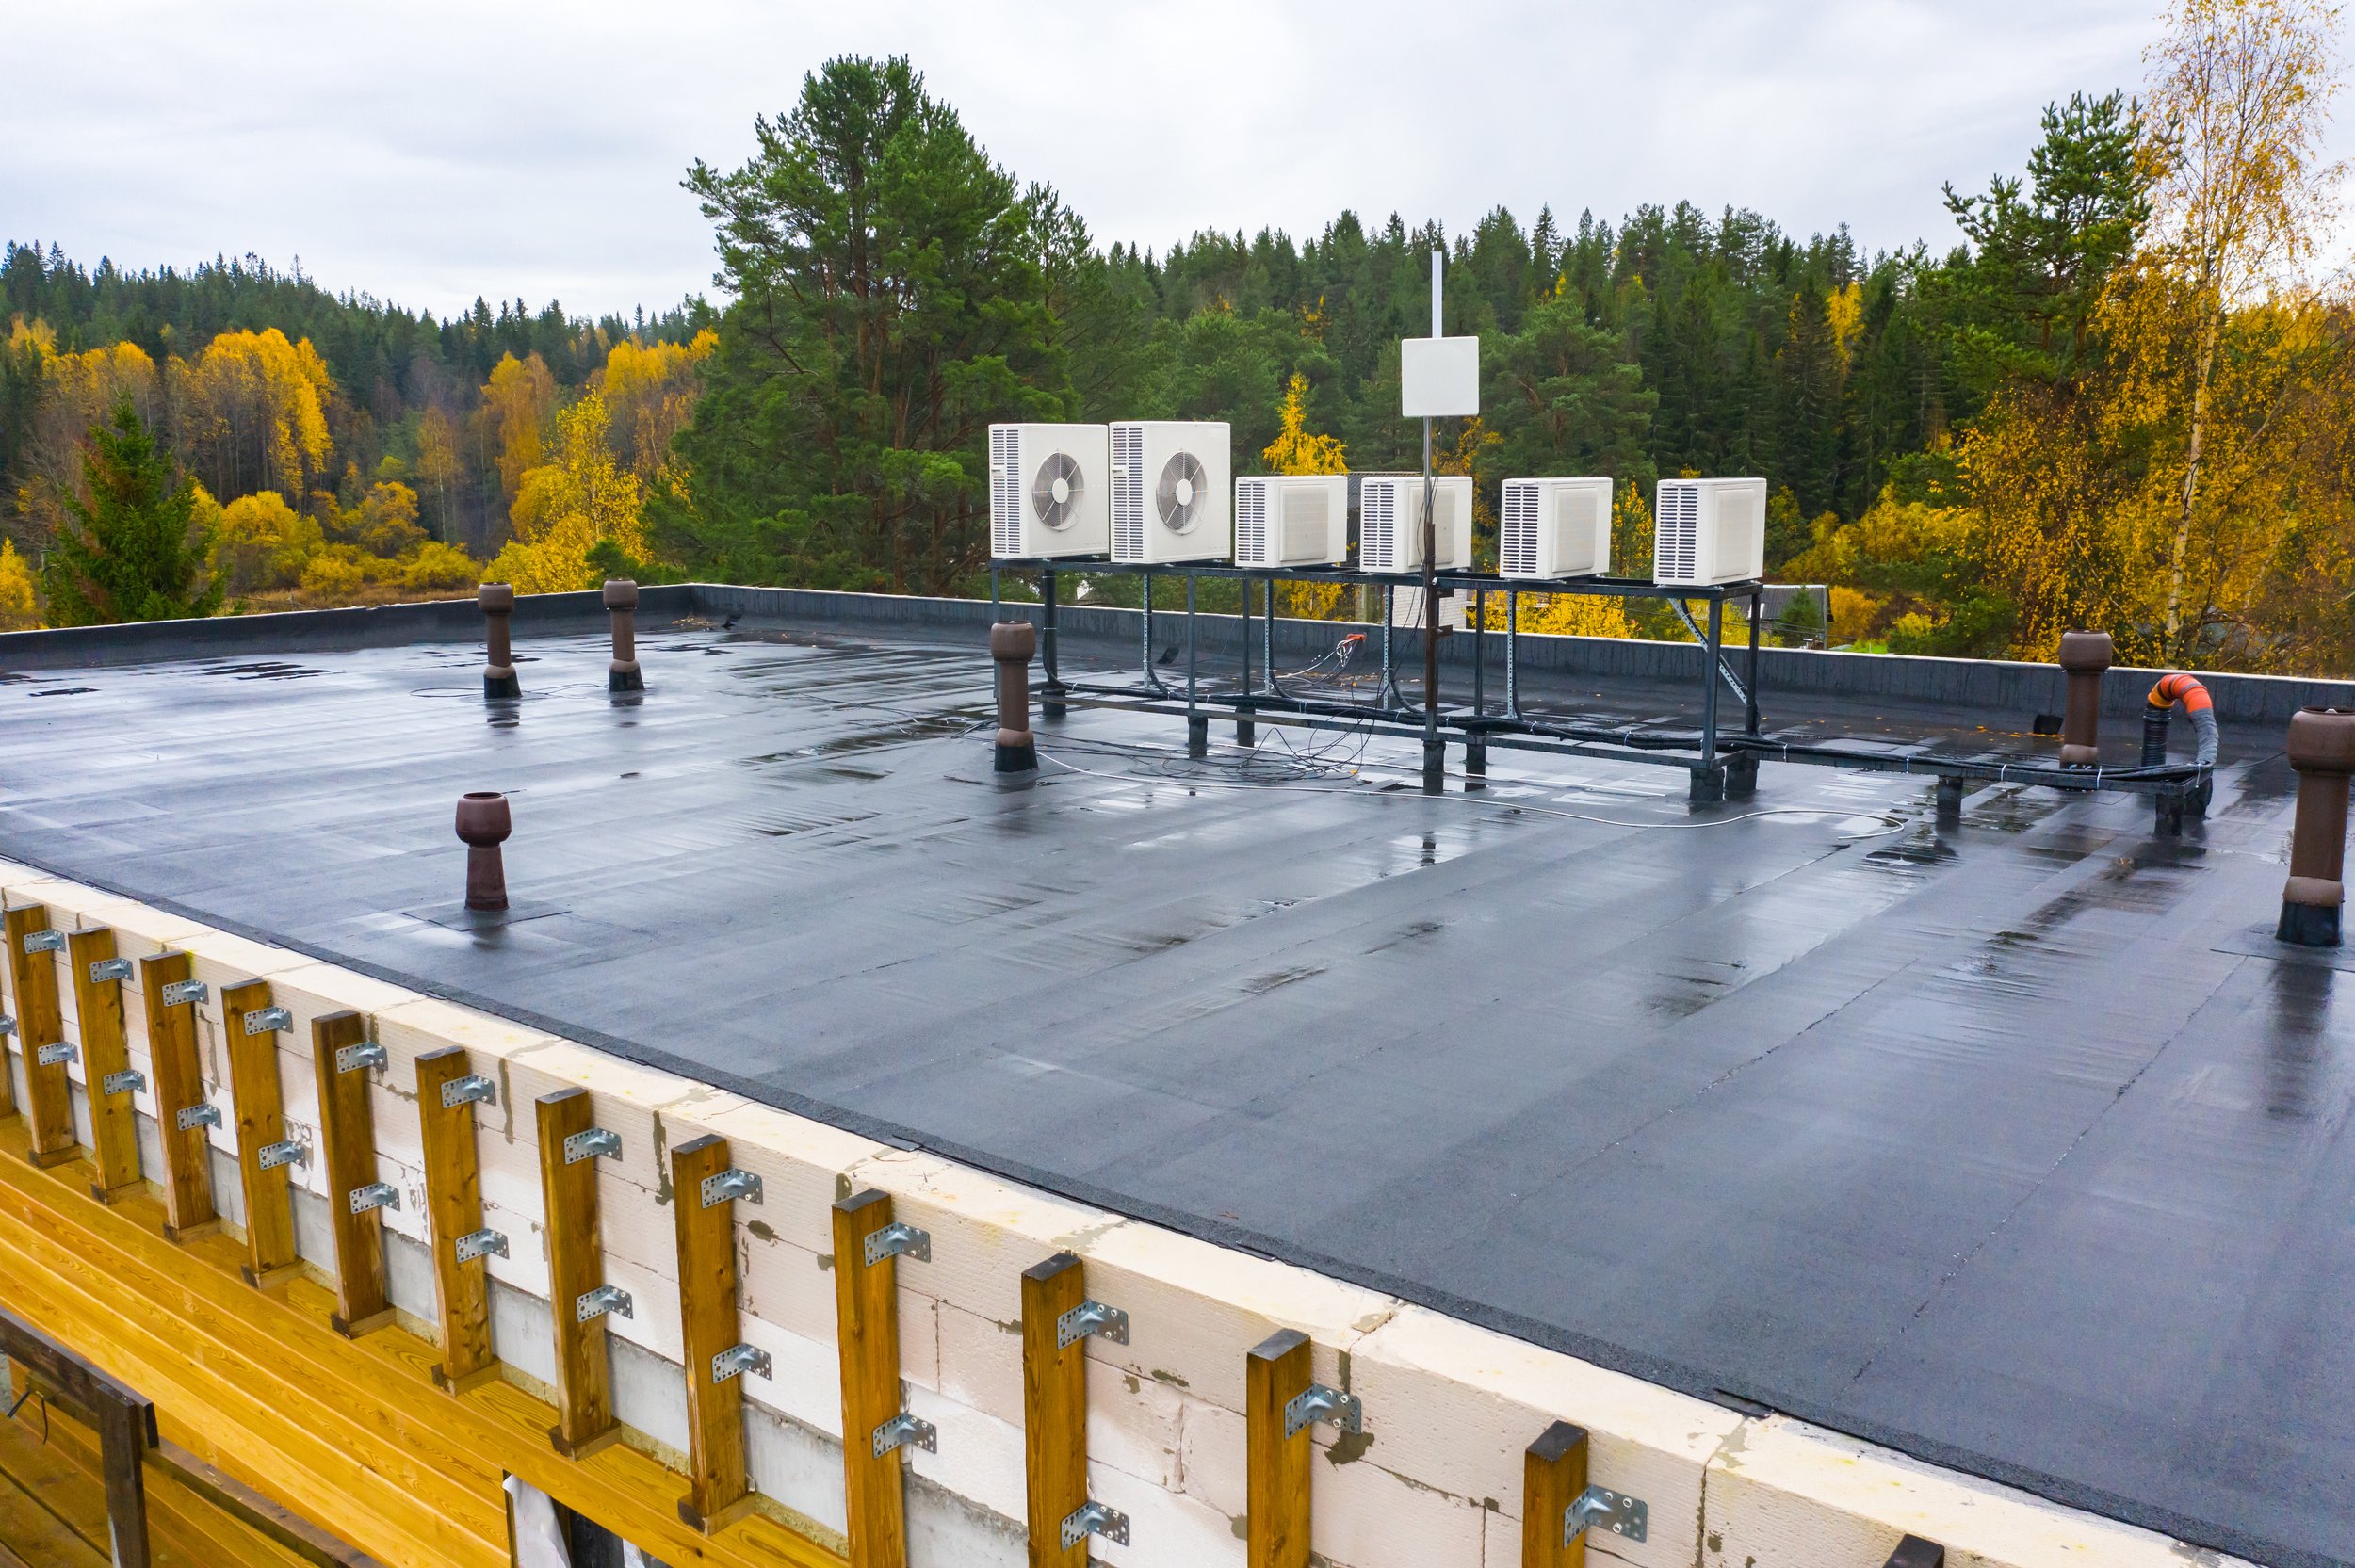
Roofing
Rooftop inspection solutions for commercial and residential roofing companies
-
![]()
Utilities
Quickly and easily inspect large amounts of distribution lines to analyze for hazards, plan maintenance and reduce risk.
-
![]()
Telecom
Understand tower condition, installed assets, and available capacity to reduce costs, improve billing, and enhance safety.


What Partners Are Saying

See Why Enterprises Turn to Zeitview
Connect with a member of our enterprise sales team to learn more, get a quote, or schedule a demo.
To learn more about our inspection services, Insights software, or pricing, please fill out the form below and a member of our team will reach out to you to schedule a time to meet.
Join our Newsletter
Be the first to know about special offers, new features, and industry news.
Support Center
Have a question about Zeitview services for your property or asset? Or want to learn more about becoming a Zeitview pilot? Visit our FAQ.
Our Blog
Learn more about exclusive Zeitview content, exclusive discounts, and industry news!